Great news, I'm getting a shed. Every man needs a shed and the plan is to move my ham radio gear into it.
It's still a few weeks off but I'm going to try to power it mostly from a solar system which ideally should be able to keep a small WSPR station going indefinitely.
Solar panels seem to vary a great deal in price, specialist solar shops seem very expensive, Jaycar is in the middle, and eBay vendors are suspiciously cheap.
There are
rumours around that the cheapest solar panels in from China lie about the power output and that's why they are so cheap.
I purchased a 65W panel with a small charge controller from
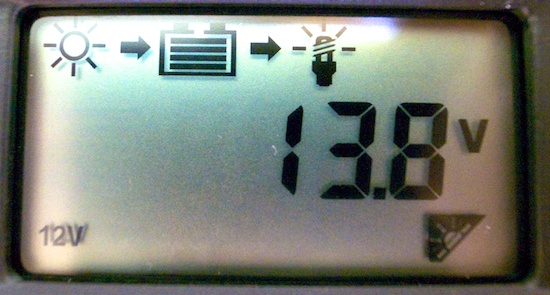
Jaycar for $400 and also bought a 26Ah battery. I don't recommend this particular charge controller, Powertech
MP3128, as it's designed to run a night light (the sales person didn't mention this). The load voltage only comes on when the solar panel is in darkness, so I'm connecting direct to the battery which risks fully discharging it. Better controllers monitor this and protect the battery.
To see if I can keep a station going, I've rigged up the solar panel, just next to the house, only vaguely north, the charge controller and a transceiver that draws 1.3A on receive, and rigged up a very simple voltage logger using an
Arduino and a
netbook. (I won't use this transceiver for WSPR but thought it was a good test load for experimentation).
The Analog input on the Arduino measures up to 5V so I'm using a roughly 4:1 resistor voltage divider to feed it. The software in the Arduino sends a measurement every 5 seconds over the USB serial link. On the netbook, I use
pyserial to read lines with the measurement, prepend the date time stamp and append to a file.
Here's the Arduino code:
const int analogInPin = A0; // Analog input pin
int sensorValue = 0; // value read
void setup() {
// initialize serial communications at 9600 bps:
Serial.begin(9600);
}
void loop() {
// read the analog in value:
sensorValue = analogRead(analogInPin);
// print the results to the serial monitor:
Serial.print(sensorValue);
Serial.print("\n");
// wait before the next loop
// for the analog-to-digital converter to settle
// after the last reading:
delay(5000);
}
Here's the simple python code on the netbook:
import serial
import time
DEVICE = '/dev/tty.usbserial-A4001KYJ'
ser = serial.Serial(DEVICE, 9600, timeout=60) # 60 seconds
line = ser.readline().strip()
while len(line):
print "%s\t%s" % (time.asctime(), line)
line = ser.readline().strip()
Today is mostly cloudy with very occasional full sun so I'm losing charge at this point. I'll gather data for a while and prepare a longer term graph but here's the first hour or so.
An Arduino and a netbook running Linux is a very useful combination.
Only a little sun this morning and now mostly cloud through the day. I used
matplotlib to draw the voltage chart to a PNG image like this:
import matplotlib
matplotlib.use('Agg')
import matplotlib.pyplot as plt
import csv
INFILENAME = 'log.txt'
VOLTSCALE = 42.4186
datareader = csv.reader(open(INFILENAME,'r'), delimiter='\t')
points = []
for row in datareader:
if len(row) > 1:
volts = float(row[1]) / VOLTSCALE
points.append(volts)
plt.plot(points)
plt.ylabel('Volts')
plt.show()
plt.savefig('voltgraph')
Here's how it looks:
With overcast skies the solar panel couldn't keep up with the 1.3A load and in the end I turned it off. I'm quite impressed with the Arduino for data logging and matplotlib for drawing graphs - much nicer than gnuplot which I've used in the past.
I'm informed that a good place to get solar panels (in Australia anyhow) is
Rockby. They are certainly cheaper than retail stores and more reputable that some suspiciously cheap Ebay sellers.




 In recent weeks we've greatly enjoyed the "Wonders of the universe" program with Professor Brian Cox.
 Given that it aired in 1980, it has stood the test of time very well.
Some of Sagan's comments about global warming are amazing for their time, although his concerns about a nuclear winter have dated somewhat.
The images of scientists smoking, sometimes pipes, in the workplace look hilarious.
Given that it aired in 1980, it has stood the test of time very well.
Some of Sagan's comments about global warming are amazing for their time, although his concerns about a nuclear winter have dated somewhat.
The images of scientists smoking, sometimes pipes, in the workplace look hilarious.