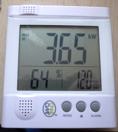
 The Cent-A-Meter has an AC current sensor you clip over the mains wire coming in to your house, (there's a version with three sensors for three phase power). The sensor transmits data on 433.92MHz to a receiver in the house that displays how much power your house is using.
Obviously I'd like to log the readings and display a graph of usage over a day and week. It's a well constructed device internally:
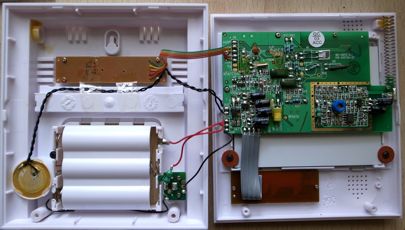
The main circuit board is clearly laid out and labelled:
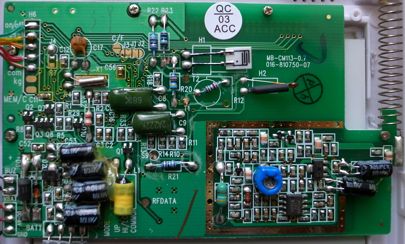
I like the RF board with its spring antenna on the right. Clearly labelled is a pad where you can pick up the serial data.
 My hope was that the protocol would be somehow simple, perhaps a pulse that varies proportionally with the current detected - I understand some monitoring systems use the flashing LED on modern electronic power meters which flashes like this. Unfortunately for me it looks to be more sophisticated than that and the actual data packet is surprisingly long for just sending one reading.
Anyhow this is a good start. It looks like there are receivers that can receive these signals so I might leave the standard client in tact and get an additional receiver to try amateur protocol analysis on.
16 comments:
Hi.
I am looking at doing this also. Any chance of a more detailed look at the digital waveform you have the photo of? thanks, Rob.
I'd love to but my CRO is not digital and the bit sequence seems quite long.
Let me know if you find any other documentation on the data format.
From what I have read elsewhere it's manchester encoded digital bit stream and probably at least 10 bytes long with a checksum after the long sequence of start bits. Any chance of recording the bit stream as an audio file which I could then digitise and look at? Happy to pass on anything I learn.
I'll see what I can do.
Managed to decode it and have it running on an arduino microcontroller with 433MHz receiver shield/daughtercard.
Mainly interesting in graphing energy use without needing a computer on 24x7 and also graphing solar generation on a second CT.
Most CT based energy monitors add up the multiple CT readings on the display unit so you can't break out individual CTs.
Fantastic work! Please share what you've found and some code, I for one would be keen to run it up.
robfarago, are you in a position to share your solution with us?
TIA
Regards
Tim
Dear robfarago
Are you able to share your solution with us?
Peter, are you still interested in this at all?
Adam,
I sure am. How can I contact you?
(Post a comment with your email and I won't publish it).
Cheers,
Peter
good work!! The thing is, Can you share your solution???
regards
Learn Hacking
If I had a decode solution I would share it. Unfortunately I don't.
Did you ever get the arduino code for this project?
@GBorsuk, no progress I'm afraid.
I know this is really old but I've just picked up one of these bad boys from a charity shop (six quid!)- it's a CM113A - CENT-A-METER.
Anyone help me get data out of it, I can solder (a bit) and have a few Pi about - would like to get this stuff in to home assistant.
Uncle google gives me very little by way of guides but maybe i'm googleing wrong.
Ta
It is an old post and Google doesn't find anything for me. My best suggestion is to get the latest rtl_433 and perhaps the protocol has been added since I last tried.
https://github.com/merbanan/rtl_433
Peter
Post a Comment